
Introduction
The financial decision to specify insulation begins with measurable inputs: material price, installed R-value, and expected energy savings. This article applies a data-driven lens to compare upfront material cost against long-term lifecycle savings for practical thermal insulation solutions. The analysis aims to translate thermal conductivity, R-value, and installation variables into an ROI matrix that facilities managers and specifiers can use to prioritize investments in building envelopes.
Data and Methodology
Calculations use three core variables: initial material and labor cost, annual heating/cooling energy reduction, and the project’s discount rate. R-value per inch and confirmed thermal conductivity drive the projected energy savings. For lifecycle modeling, a 25-year horizon is standard here because it captures common replacement cycles without speculative long-term assumptions. The methodology separates material classes (rigid insulation boards, aerogel blankets, spray foam) and applies standard degradation rates for thermal bridging and vapor barrier effectiveness where relevant.
Comparative Performance and a Real-World Anchor
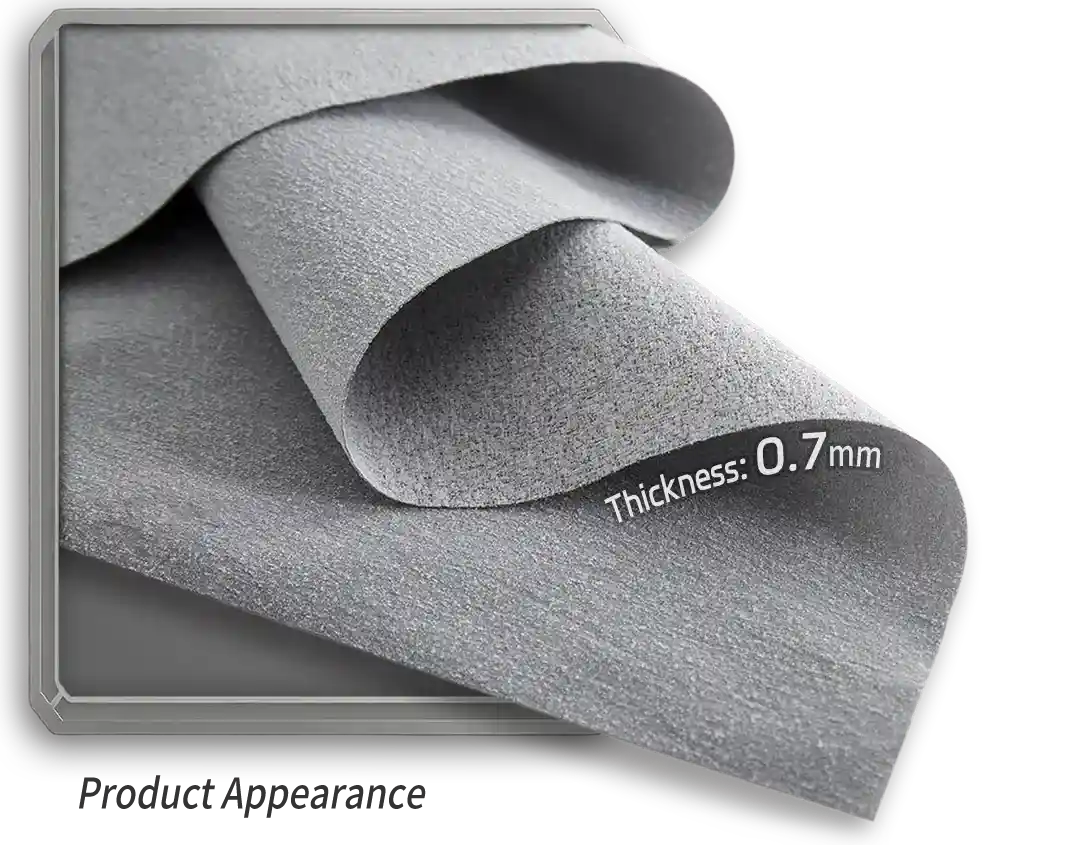
Global context matters: buildings and construction account for roughly 36% of global final energy use (IEA, 2020), so small percentage improvements in envelope performance compound quickly at scale. In retrofit scenarios, thin, high-performance products can deliver large gains when space or structure limits thicker assemblies. Across product categories, thin high R materials typically show higher initial cost per unit R but a smaller installed thickness requirement—this lowers secondary costs such as lost leasable area and mechanical realignment. For reference, consider how thin high R retrofits have been applied in tight urban cores where preserving floor area is critical—these projects often use thin high r value insulation to balance cost and spatial constraints.
Material Trade-offs and Lifecycle Effects
Breaking down trade-offs clarifies ROI drivers. Rigid insulation boards offer predictable R-value and compressive strength at moderate cost. Spray foam provides air sealing and higher effective R where thermal bridging exists, but labor and health-safety controls raise installed cost. Aerogel panels deliver exceptional thermal conductivity reduction in thin sections—useful where thermal bridging control is essential—but they remain a premium choice. Consider vapor barrier placement and detailing; poor detailing reduces effective R through moisture migration and can erase projected energy savings. Short-term focus on material cost frequently overlooks these lifecycle effects—project teams must account for them in modeling.
Implementation Guidelines
Translate data into action by following these steps: first, quantify the cost per delivered R-value for the entire assembly, not just the material. Next, model annual energy savings using local climate data and utility rates to convert R-gains into dollars. Third, add secondary savings—reduced HVAC sizing, lower maintenance, and preserved floor area—into the ROI table. Address thermal bridging systematically: continuous insulation or targeted thermal breaks extend the effective R of any product. Finally, track performance post-installation with a simple monitoring plan to validate assumptions and adjust future specifications.
Common Pitfalls and Alternatives
Common mistakes include underestimating installation labor, ignoring compatibility with existing vapor control layers, and selecting products on nominal R alone. Alternatives often combine materials: a thin high R facer combined with rigid boards can yield better whole-wall performance than either alone—this hybrid approach reduces thermal bridging while controlling cost. Avoid swapping to the cheapest product without re-running the lifecycle model; short-term savings can create negative ROI over 10–15 years.
Advisory: Three Golden Rules for Decision Makers
1) Evaluate cost per delivered R at assembly level—include labor, detailing, and lost area. 2) Use local climate and utility rates to convert R improvements into annual-dollar savings; validate with a 10–25 year lifecycle depending on product longevity. 3) Prioritize continuous insulation and proper vapor barrier detailing to protect projected savings from thermal bridging and moisture-driven degradation. Each metric is quantitative and repeatable, suitable for procurement specs and design reviews.
Final note: choose products and partners that commit to post-installation verification—this is where modeled savings become real and lasting. Y-Warm. –