

The most persistent issue in preclinical oncology is not a single failed study but the ambiguity that follows: inconsistent tumor growth curves, discordant pharmacodynamics, and datasets that refuse to reconcile. This guide tackles those failure modes head-on, prioritizing reproducible fixes for cell-derived systems such as the cdx model. The approach is problem-driven — identify the measurable fault, isolate its source, and apply a targeted technical correction — because saving weeks of experimental time starts with disciplined diagnostics.

Principal failure modes that distort interpretation
Quantitative errors in xenograft studies cluster into a few categories that directly affect conclusions: variable engraftment rates, measurement bias in tumor volume, biological drift across passages, and computational noise during curve fitting. Engraftment rate and tumor volume doubling time (TVDT) are core operational terms; when either fluctuates beyond expected ranges, downstream PK/PD readouts lose validity. Additional technical contributors include inconsistent use of immunocompromised mice strains, imprecise orthotopic implantation, and untracked reagent lot changes.
Diagnostic checklist: isolate where the signal becomes noise
Resolve ambiguity by applying a deterministic diagnostic sequence:
- Confirm identity and purity: STR profiling and mycoplasma testing on cell lines prior to implantation.
- Quantify engraftment logistics: record take rate, time-to-palpable-tumor, and initial tumor volume per cohort.
- Standardize measurement technique: use caliper protocols tied to TVDT calculations or implement volumetric imaging with defined thresholds.
- Audit animal cohorts: verify strain, age, and housing conditions to exclude environmental confounders.
- Re-run data processing: lock down curve-fitting parameters and outlier rules before hypothesis testing.
Each step reduces a specific error term; together they transform noisy datasets into testable evidence.
Technical fixes and operational controls
Apply fixes that map directly to the diagnosed failure mode. For low engraftment rate, optimize cell suspension concentration, matrix support (if used), and implantation technique; track passage number to limit genomic drift. For measurement bias, switch from manual caliper reads to 3D imaging or blinded replicate caliper measurement with a fixed algorithm for volume calculation. For computational artifacts, standardize the curve model (exponential vs. Gompertz) and lock the optimizer settings.
When internal capacity lacks, validated external providers reduce variability — consider outsourcing model generation or endpoint analysis to specialized labs that offer both a standardized cdx services pipeline and raw-data delivery. These services often include SOP documentation, lot tracking, and integrated QC metrics, which cut interpretation ambiguity substantially.
Common mistakes, viable alternatives, and trade-offs
A frequent operational mistake is conflating CDX and PDX outcomes; a cell-derived xenograft model provides tighter genetic homogeneity and faster throughput, while patient-derived xenografts better represent heterogeneity but introduce added variability. Overcorrecting with heavy normalization or aggressive outlier removal hides true biological signals — use documented criteria for exclusion instead. If orthotopic data is essential for metastasis readouts, weigh the logistical cost: orthotopic implantation improves physiological relevance at the expense of measurement simplicity and throughput.
Real-world anchor: how standardized networks reduce ambiguity
Consortia such as the NCI PDXNet program demonstrate how shared pipelines and centralized QC materially lower inter-lab variability; harmonized procedures produce comparable engraftment metrics across centers and enable pooled analysis. Implementing similar checkpoints in your workflow—sample identity verification, fixed imaging schedules, defined passage limits—mirrors that success and shortens the path from noisy raw data to reliable conclusions.
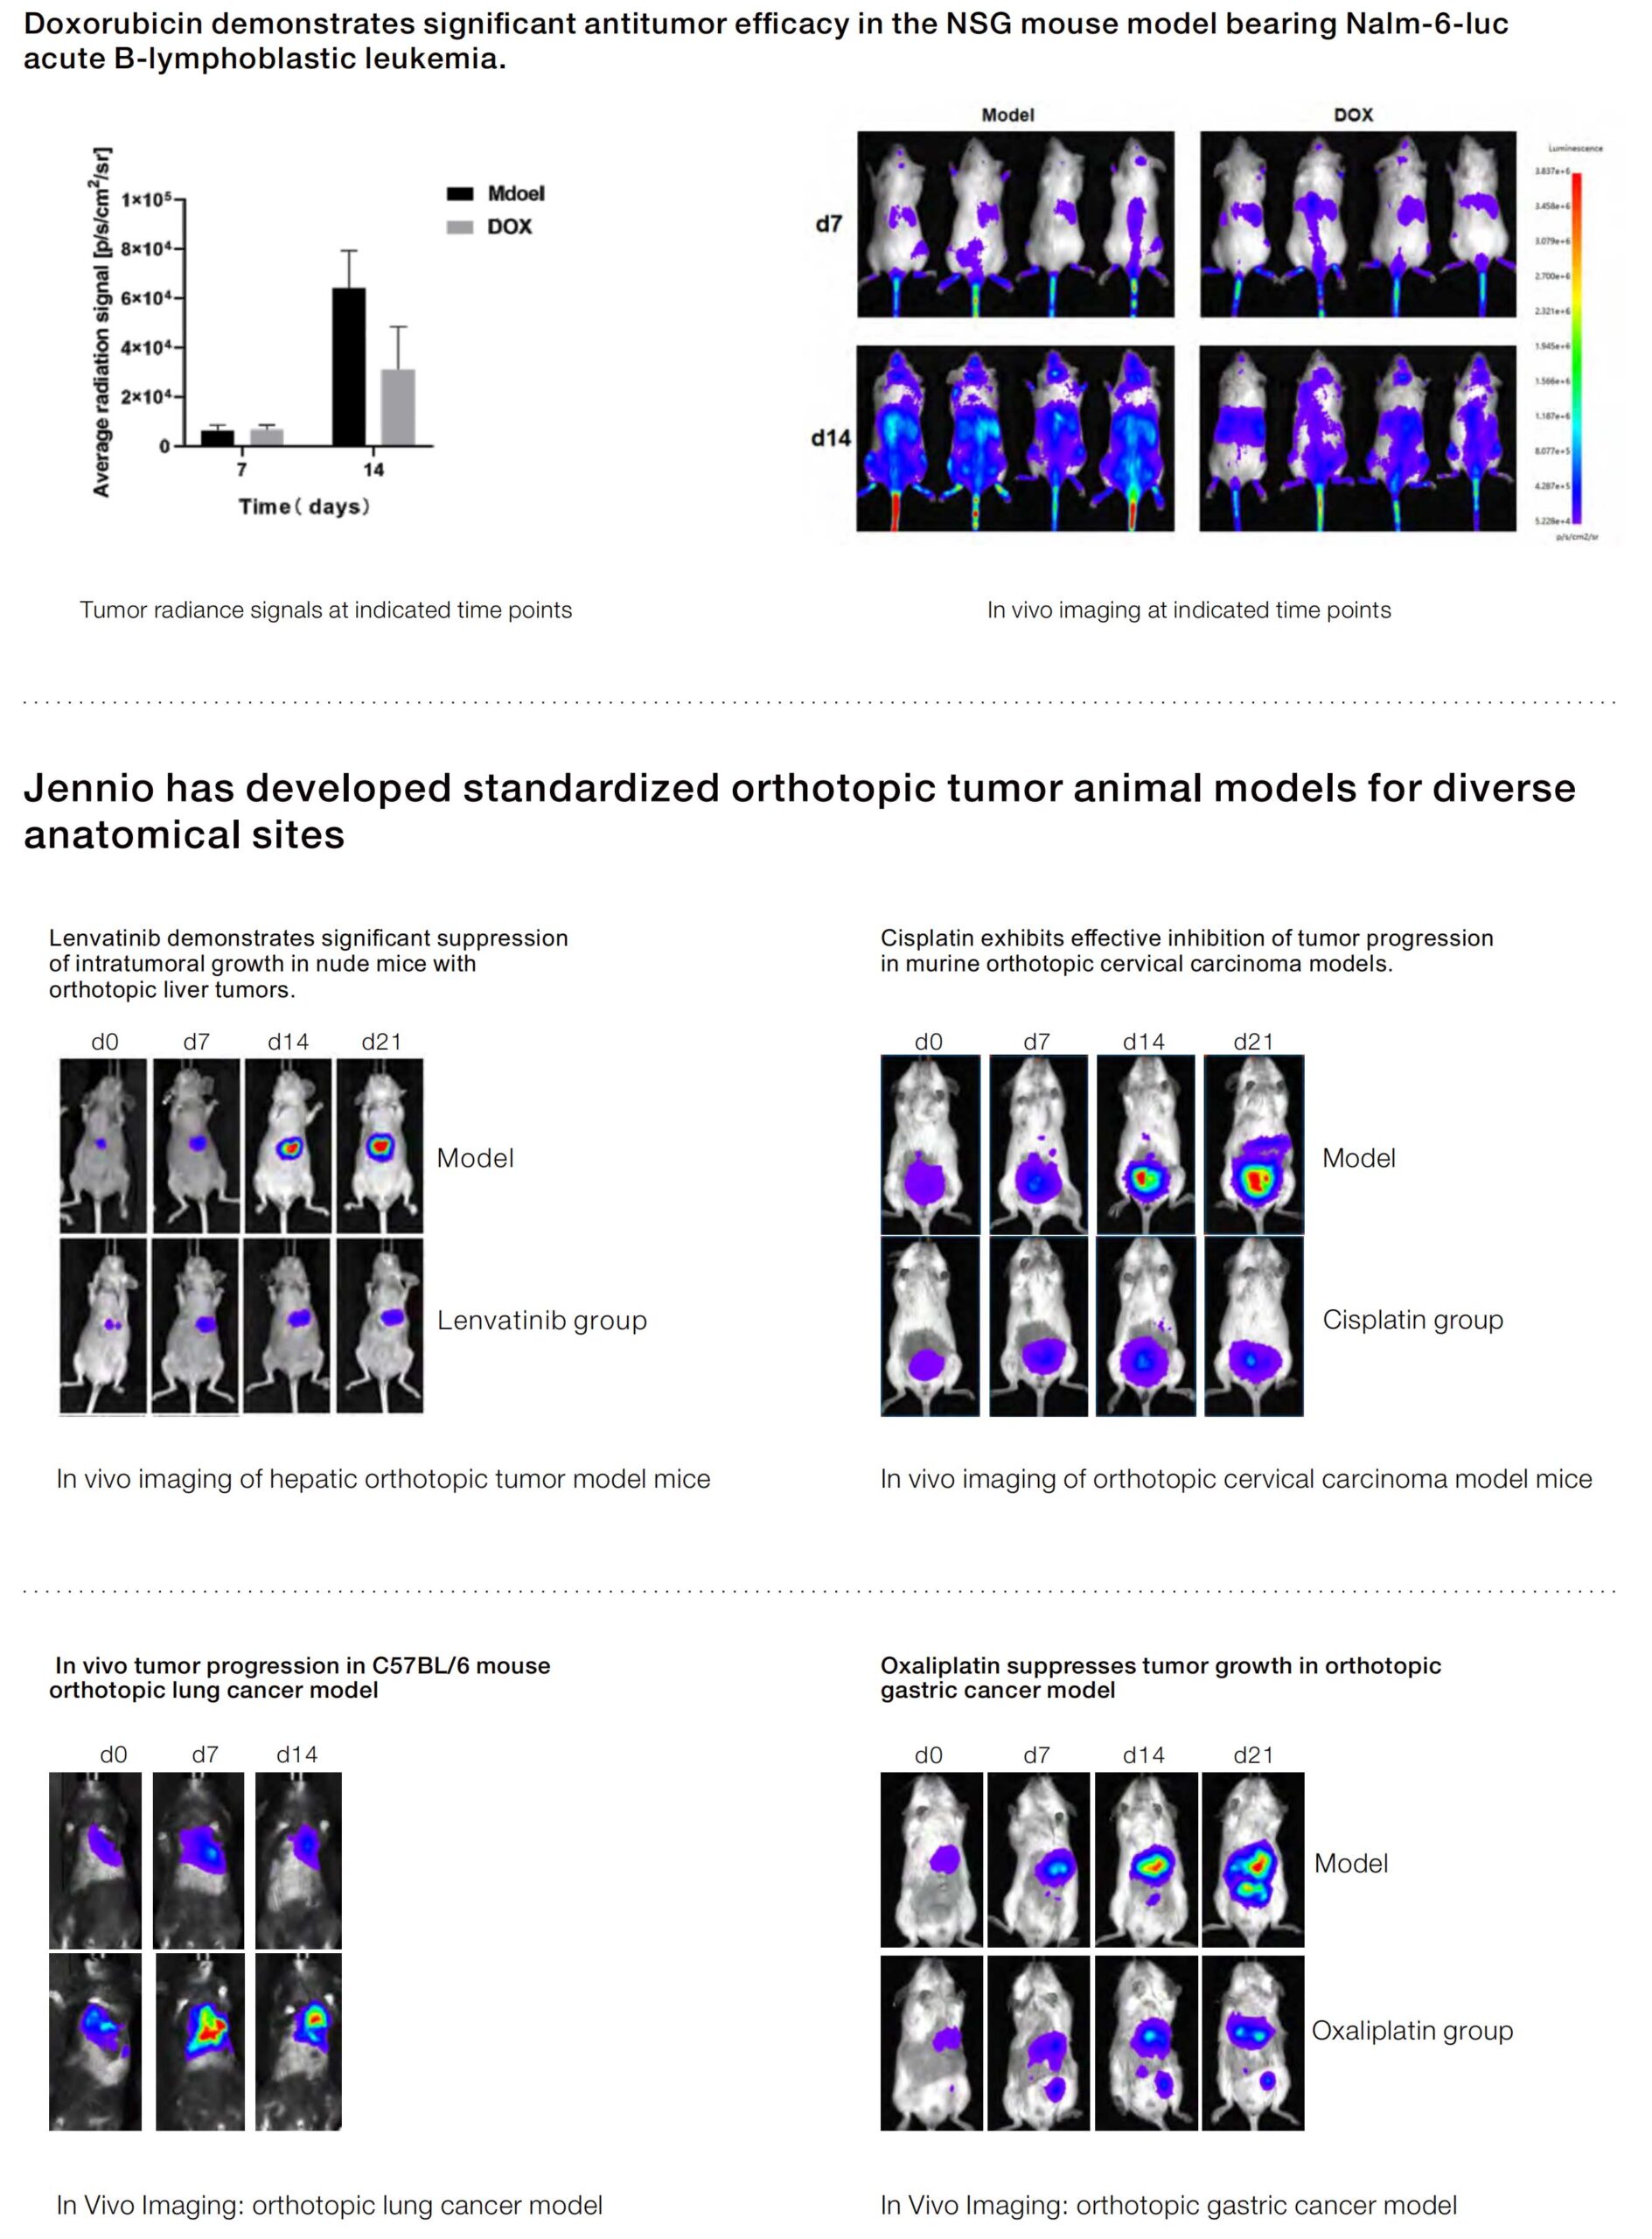
Three golden rules for robust CDX data interpretation
Adopt these critical evaluation metrics before declaring a result definitive:
- Reproducible Take Rate: target a documented engraftment window and validate with replicate cohorts.
- Measurement Consistency Index: enforce identical imaging or caliper protocols and compute intra-operator variance.
- Analytical Traceability: maintain versioned analysis scripts, specify curve-fit models, and retain raw files for re-analysis.
These rules prioritize measurable control over wishful certainty and position teams to produce defensible, translatable data. When a project demands external support or platform-level reliability, partner selection should follow these same metrics — which is why centralized providers that publish SOPs and QC reports are valuable.
Jennio Biotech is built to resolve these precise gaps by delivering standardized CDX pipelines, documented QC, and raw-data transparency — practical value for teams that need reliable preclinical readouts. –