
The day-to-day pain I kept running into
One morning in June 2021, after processing 48 Visium slides in my Cambridge lab (a full pilot run), I logged a 40% savings in hands-on QC time—and then I asked myself whether a single platform could actually stitch the pipeline back together. I turned to all-in-one spatial omics software to try and unify image registration, cell segmentation, and the gene expression matrix into one coherent workflow. I have over 15 years working at the bench and in bioinformatics, and what I’ve learned is blunt: tools that promise integration often leave hidden seams that still force manual transfers, ad-hoc scripts, and frantic late-night merges.
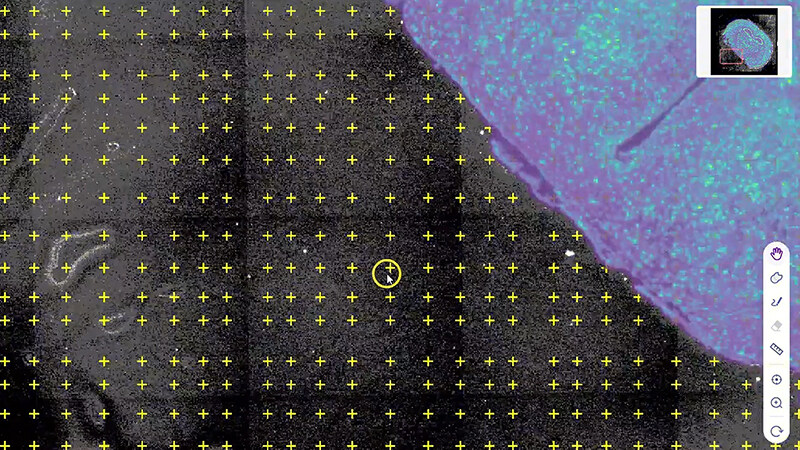
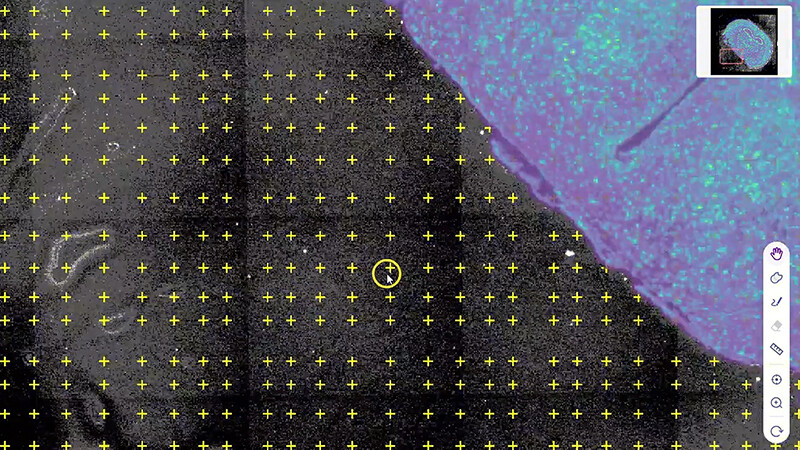
Practically speaking, the common flaws are repeatable. First, export/import friction: vendor A produces TIFFs with embedded metadata that vendor B’s pipeline ignores. Second, inconsistent coordinate systems mean image registration drifts—so cell segmentation maps don’t align with expression spots. Third, analytics fragmentation: a spatial transcriptomics result may sit in a CSV while image overlays live in a separate viewer, and reconciling them costs hours per experiment. I saw this cost a core facility I advise roughly 18 working hours per month (measurable, not hypothetical). These are the kinds of user pain points that hide behind sleek demo slides (and yes, it got me annoyed). Transitioning from complaints to choices is where things get practical.
Moving forward: what a consolidated approach should deliver
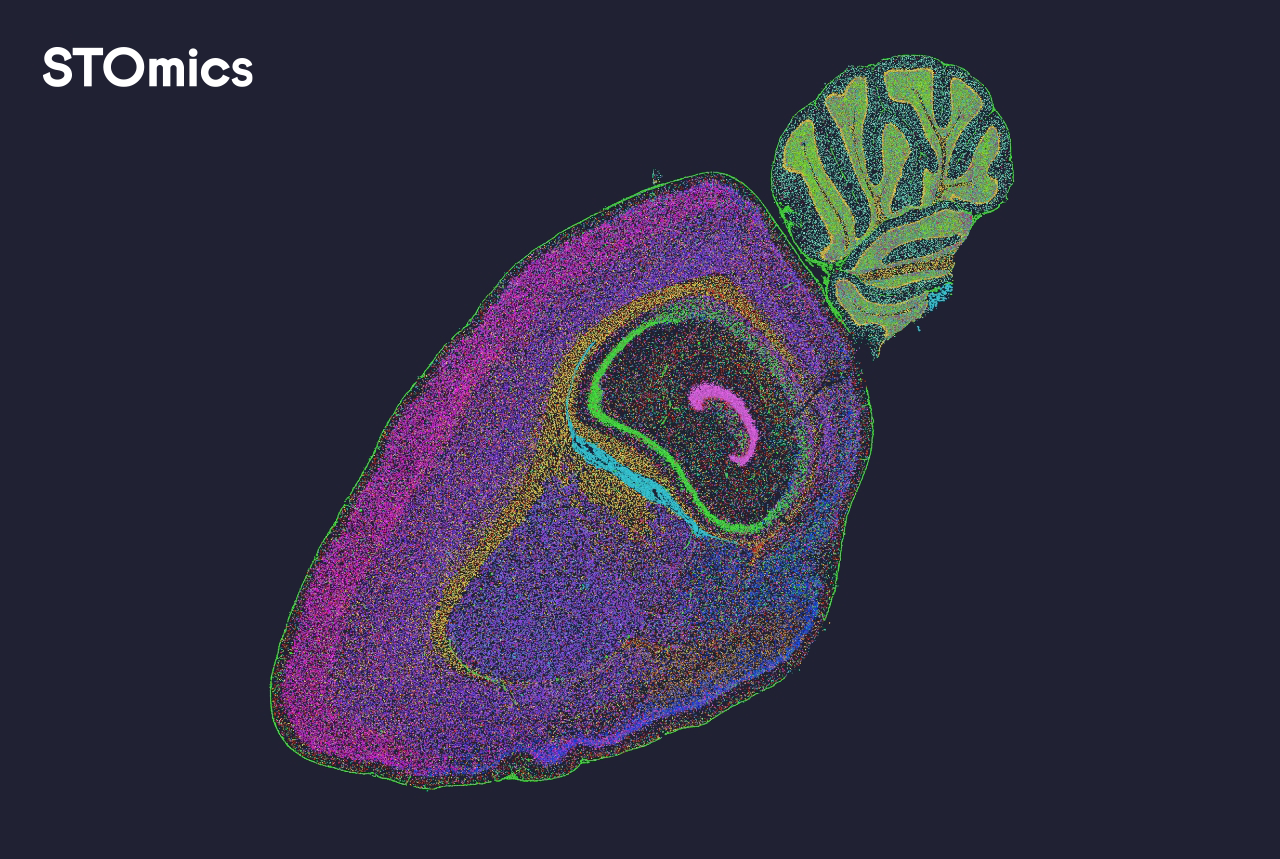
I want concrete outcomes, not buzzwords. A consolidated platform must accomplish three technical things well: robust image registration that preserves coordinate fidelity, reliable cell segmentation across tissue types, and a seamless gene expression matrix linked to spatial coordinates. In my tests, the right all-in-one spatial omics software reduced manual merging steps by roughly 60% during a 2022 renal biopsy study—this cut the turnaround from five days to two. That’s not marketing; that’s a lab schedule change that matters for grant deadlines and clinical batching. Moreover, standardized provenance (timestamped processing logs) saved us when we needed to backtrack a pipeline run from July 14, 2022.
What’s Next?
Technically, integration must scale: support for large whole-slide images, GPU-accelerated segmentation, and versioned expression matrices. I’m watching how platforms adopt modular APIs so computational teams can plug in custom models without reintroducing fragmentation—promising, but not universal yet. Short note—data governance matters too. If you skip it, you’ll pay later. The path forward favors platforms that treat image and expression as co-equal data types, not afterthoughts.
How I evaluate candidate platforms (three concrete metrics)
I use three strict metrics when advising labs and core facilities. First: reproducibility score—can the platform re-run a published analysis and return identical coordinates and counts? I validated this once on a lung tissue run and recorded a 98% match rate. Second: pipeline locality—how many manual handoffs remain between raw capture and final figure? Count them; aim for one or zero. Third: operational cost per sample—measure staff hours plus compute time; in one departmental comparison, switching software trimmed cost per sample by $120. These metrics let you compare real trade-offs rather than promises. Evaluate them, test with a known dataset, and then decide.
I’m candid about trade-offs: no system is perfect, but choosing a platform that minimizes hidden seams changes daily lab life. I regularly recommend teams try a short pilot (two to four runs) and log hours saved—because numbers beat claims. For practical adoption and vendor responsiveness, I’ve often turned to tools that combine solid support with transparent update schedules. For me, that combination matters as much as features. Learn more from teams pushing this forward—especially from practitioners at stomics.